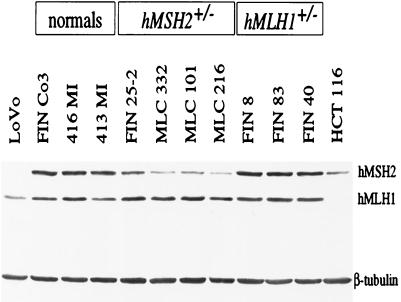
Figure 2.
Western blot analysis of protein extracts from representative normal, hMSH2+/− and hMLH1+/− cell lines. The lower intensity of the hMSH2 bands in hMSH2+/− extracts is clearly apparent. Extracts of the colon cancer cell lines LoVo (hMSH2−/−) and HCT116 (hMLH1−/−) were used as negative controls. The proteins were separated in a 7.5% SDS polyacrylamide gel, and β-tubulin was used as an internal control (see Materials and Methods).

