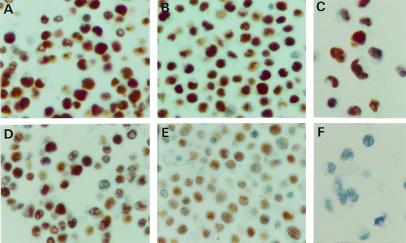
Figure 3.
Immunohistochemical analysis of hMLH1 (Upper) and hMSH2 (Lower) levels. As shown (Upper), the normal control (A), the hMSH2+/− line MLC21 (B), and the hMSH2−/− line HEC59 (C) contain similar amounts of hMLH1. In contrast, the hMSH2+/− line MLC21 (E) contained substantially less hMSH2 than the normal control (D). No brown staining indicative of hMSH2 is apparent in the HEC59 line (hMSH2−/−) used as a negative control (F)

