
FIGURE 3. Multiple-round in vitro transcription assays of WT and T127L/S128I CRP proteins.
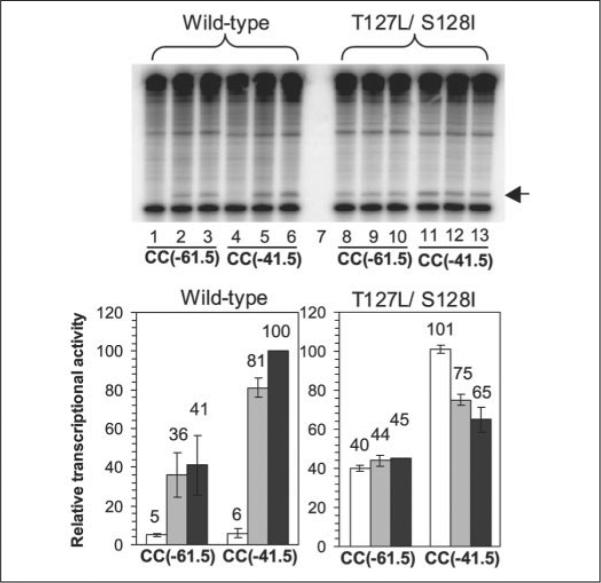
Measurements were carried out for both Class I (CC(−61.5)) and Class II (CC(−41.5)) promoters under three conditions (no cAMP, 0.1 mM cAMP, and 1 mM cAMP). The gel is of radiolabeled transcripts from the assays. Lanes 1, 4, 8, and 11, no cAMP; lanes 2, 5, 9, and 12, 0.1 mM cAMP; lanes 3, 6, 10, and 13, 1 mM cAMP. Lane 7 is empty. The bars in the histograms represent the average of two independent assays. White bars, no cAMP; light gray bars, 0.1 mM cAMP; dark gray bars, 1 mM cAMP. The data in the histograms are presented as a percentage of activation by WT CRP at the CC(−41.5) promoter in the presence of 1 mM cAMP. The experiment was performed with supercoiled templates (26, 27) in the presence of RNA polymerase containing σ70. CRP-dependent transcripts are indicated by the arrow and are located just above the control transcripts from the RNA I promoter. Both proteins were His6-tagged at their C termini and used at a concentration of 200 nM.