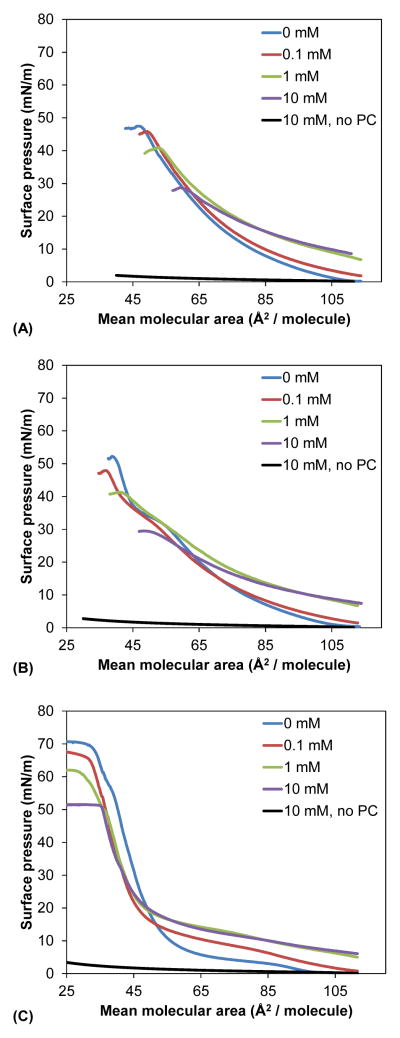
Figure 5.
Representative compression isotherms (from three replicates) for (A) DMPC (B) DPPC and (C) DSPC in the presence of increasing concentrations of PFBS. The compression isotherms were obtained at 37 °C on a subphase consisting of 150 mM NaCl and 1.5 mM CaCl2, with a compression rate of 10 mm/min (7.5 cm2/min). PCs were added as a solution in 9: 1 (v: v) hexanes: ethanol, which was allowed to evaporate before compression. The LE-to-LC transition for DPPC is shown with an arrow. Control isotherms were obtained by addition of blank solvent to PFBS-containing subphases followed by compression. Only the control for the 10 mM PFBS subphase, which gave the highest surface pressure change upon compression, is shown on each graph.

