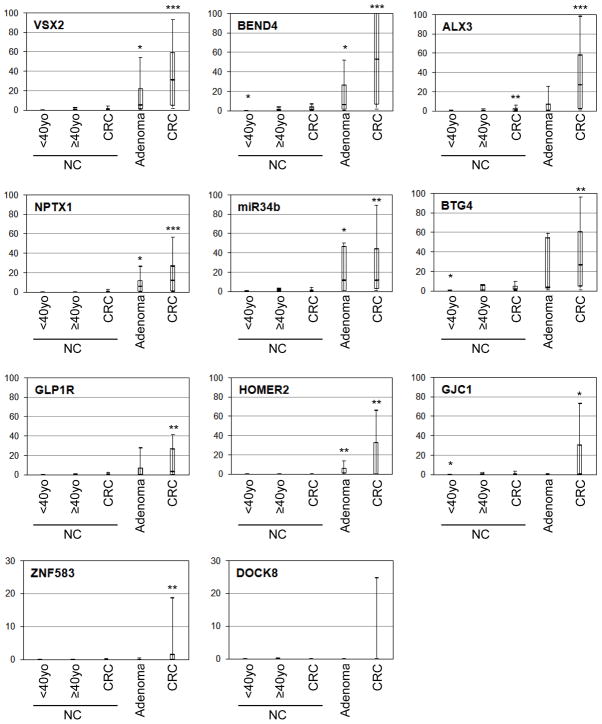
Figure 2. Loci methylation levels for neoplastic and non-neoplastic colonic tissues.
These box plots represent the qMSP results of 51 CRCs and 9 adenomas, and 53 non-neoplastic colonic mucosal tissues (NCs, 8 young control NCs, 26 control NCs, and 19 CRC-NCs). Y-axis represents PMR value. Data on 11 loci that demonstrated methylation in at least one of the neoplastic tissues are shown. Median (bar), 25–75 percentile range (box), and 10–90 percentile range (whisker) of all informative specimens are displayed for each tissue category. Single-, double-, and tripleasterisks indicate significant difference from control NCs at p-level <.05 <.01, and <1E-6, respectively.

