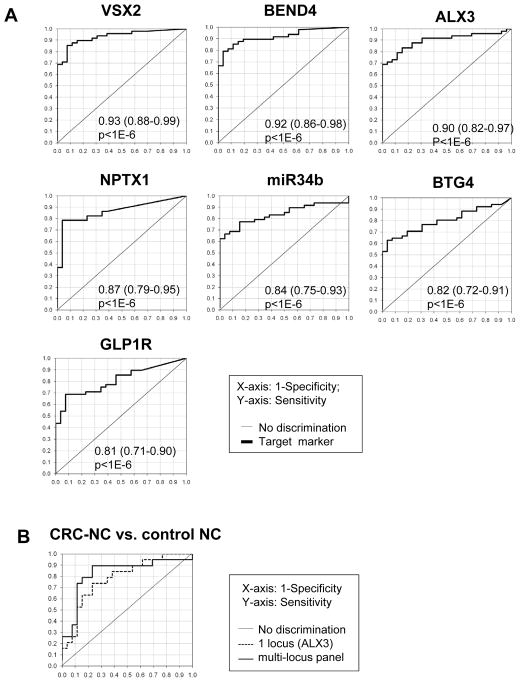
Figure 3. The ROC curve-based assessment of methylation markers’ diagnostic accuracy.
A. The ROC curves representing the distinction of CRCs from control NC are shown for the seven loci demonstrating AUROC values >0.8. Mean and 95%CI of AUROC as well as p-value are shown in each panel. B. The ROC curves based on the multi-loci diagnostic panels are shown for the distinction of CRCs from control NCs. Gray solid line, and black solid line correspond to the profiles for the best single locus (ALX3) and the multi-locus panels (ALX3, ZNF583, miR34b, and VSX2), respectively.

