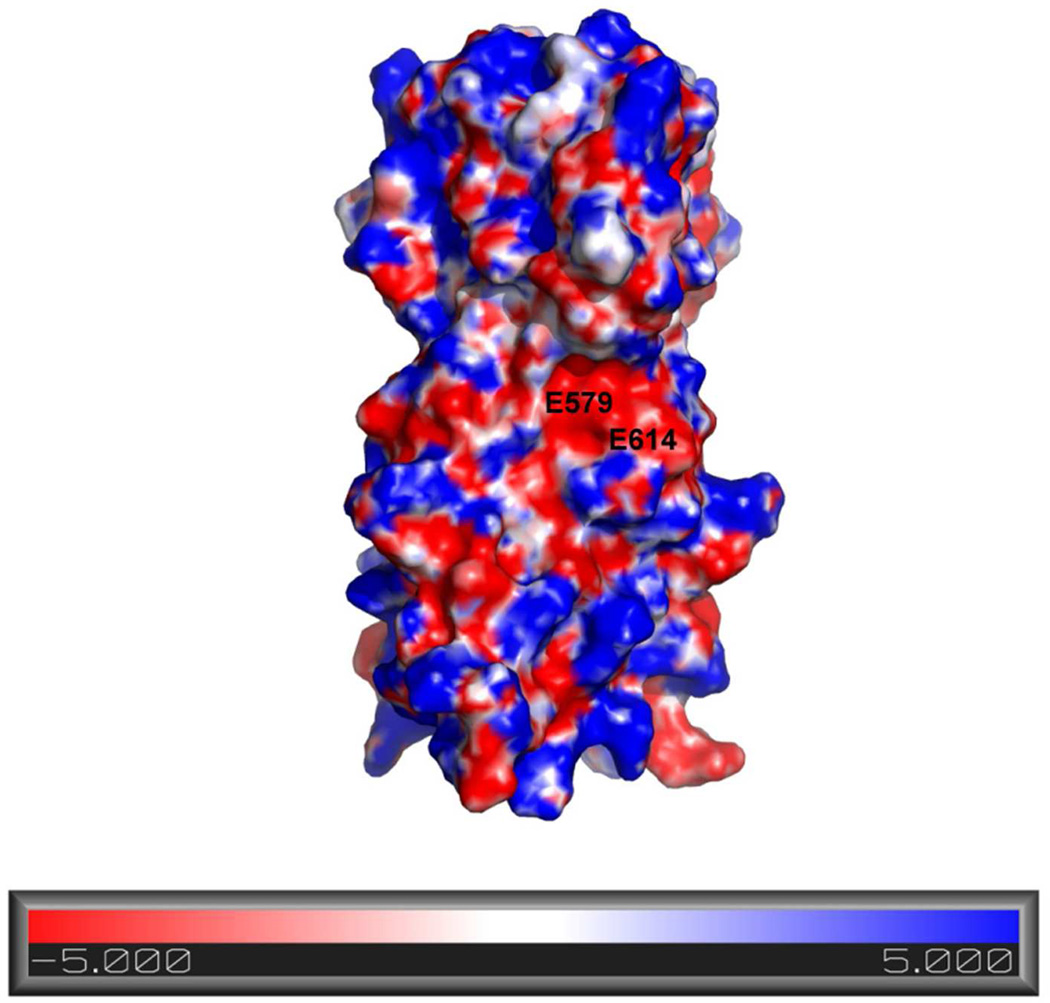
Figure 5. Calculated Electrostatic Surface Potential.
To generate the surface electrostatic map of MARV GP2, the PBEQ-Solver server was used with the generic presets (refs. 62–64). A solvent accessible surface representation of MARV GP2 is shown with an electrostatic potential map [+5 kcal/(mol e) in blue to −5 kcal/(mol e) in red]. The surface of MARV GP2 is highly charged and the anionic stripe forms an electronegative pocket in the center of the protein. The surface exposed residues that make up the anionic stripe, E579 and E614, are labeled.

