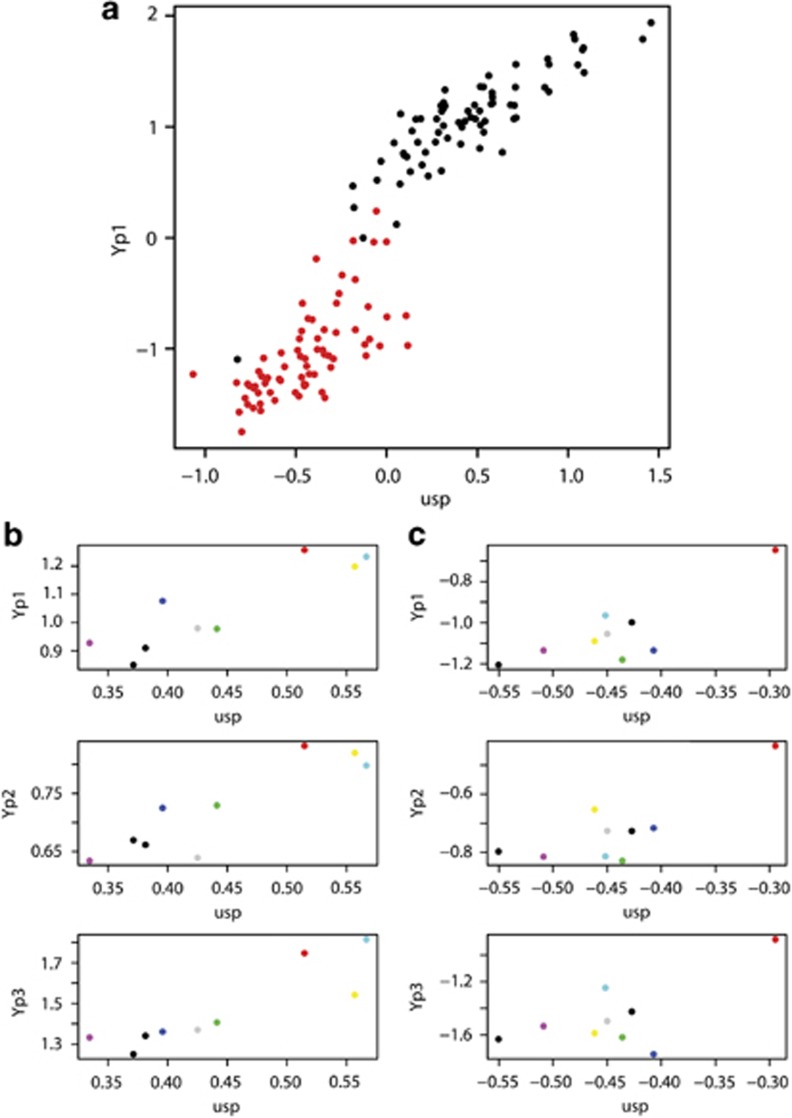
Figure 4.
Plots of Yp expression in terms of usp expression. These profiles were typical of usp, Aef1, her, ix, dsxF and Rbp1-like. (a) Yp1 expression as a function of usp expression from the diallel crosses displays linear responses within a sex, but a sigmoidal response between the sexes. Males are displayed in red and females in black. (b) Mean expression in females for each parental line, with each line assigned a different color that is the same in all. There were three lines that expressed high levels of usp, which also produced the highest Yp expression levels. These lines were much less likely to produce crosses that expressed Yps at intermediate levels. (c) Mean expression in males for each parental line, with each line assigned a different color. There was one line that expressed high levels of usp, which also produced the highest Yp expression levels. This line was much more likely to produce crosses that expressed Yps at intermediate levels.

