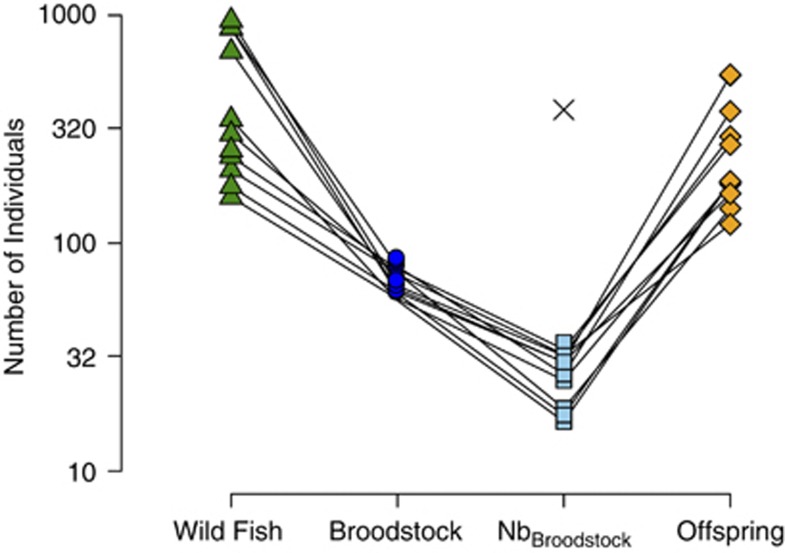
Figure 2.
Genetic bottlenecks created by the supplementation program. Triangles (‘Wild Fish') represent the total number of wild fish passed over the dam for 11 consecutive years. Circles (‘Broodstock') are the total number of wild fish removed from the run and used in the supplementation program. Squares (‘Nb Broodstock') are the effective number of broodstock breeders calculated using pedigree data. The × represents the average effective number of breeders for the wild population as calculated in Araki et al. (2007c). Diamonds (‘Offspring') represent the total number of hatchery offspring assigned to the broodstock from a given run-year. Notice that the ordinate is on a logarithmic scale and that solid lines connect years. A full color version of this figure is available at the Heredity journal online.

