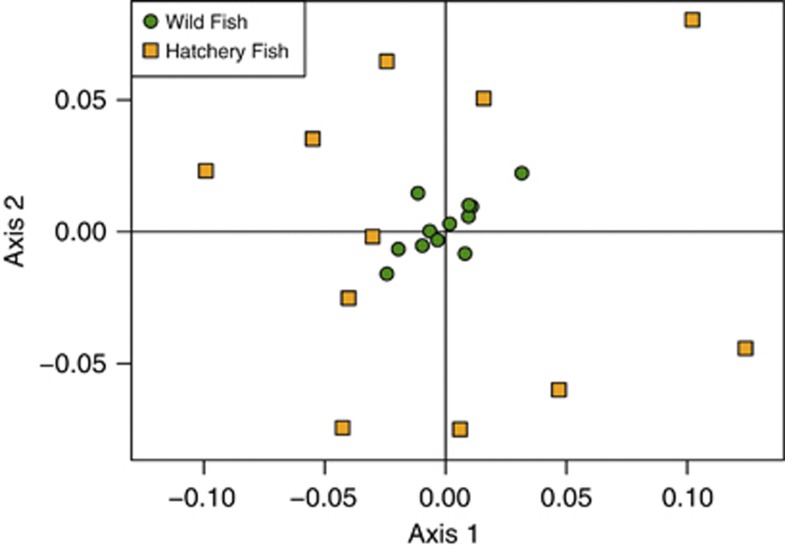
Figure 3.
Principal coordinates analysis of pairwise FST between all brood-years of hatchery and wild fish. Circles represent wild fish and squares represent hatchery fish. Notice that the FST between hatchery brood-years is substantially greater than wild brood-years owing to the small effective number of breeders. A full color version of this figure is available at the Heredity journal online.

