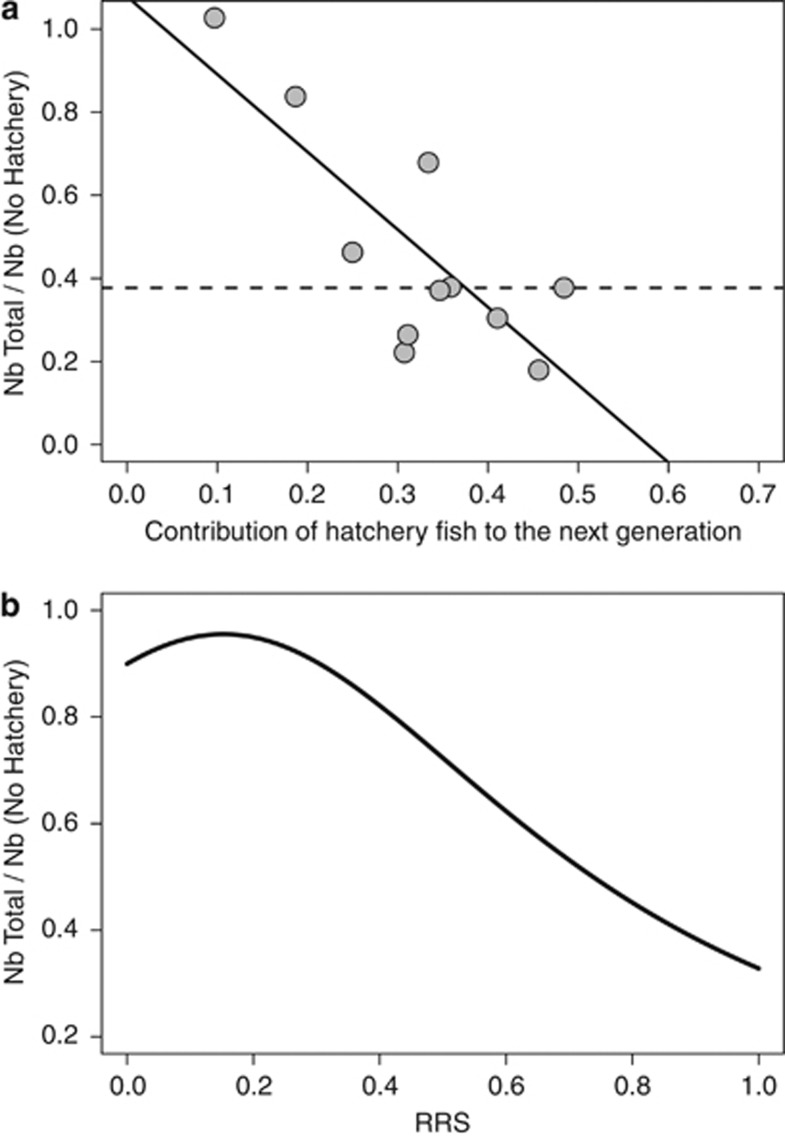
Figure 5.
Illustration of a substantial Ryman–Laikre effect. The ordinate equals the total effective number of breeders (hatchery and wild fish pooled; Nb Total) divided by the effective number of breeders for the population had no hatchery program been implemented (Nb No Hatchery). Thus the ordinate equals the magnitude of the Ryman–Laikre effect (with smaller values equating to a stronger effect). (a) Relationship between the contribution of hatchery fish to the next generation (see Equation (4)) and the Ryman–Laikre effect for 11 brood-years. The dashed line represents the median ordinate value for all years. RRS was fixed at 0.85 such that the contribution of hatchery fish directly reflects the proportion of hatchery fish allowed onto the spawning grounds. (b) Relationship between relative reproductive success of hatchery fish (RRS) and the Ryman–Laikre effect. For visual clarity, we took the harmonic mean of Nb Total and the harmonic mean of Nb No Hatchery across all 11 brood-years to generate a single point estimate for each distinct RRS value.

