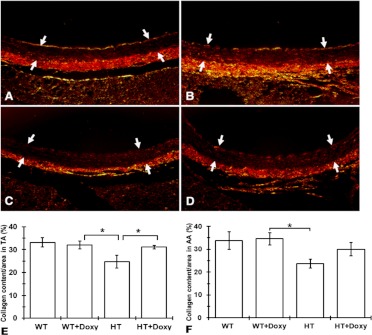
Fig. 1.
Collagen content of aorta in 9-month-old mice. A to D, representative picrosirius red-stained slides of aortas of 9-month-old mice viewed under polarized light (×400). Arrows indicate tunica media. Shown are WT untreated mice (A), WT doxycycline-treated mice (WT + Doxy) (B), HT untreated mice (HT) (C), and HT doxycycline-treated mice (HT + Doxy) (D). E and F, average content of collagen in thoracic aorta (TA) (E) and abdominal aorta (AA) (F). Values are means ± S.E.M. ANOVA with Duncan post hoc test. *, p < 0.05.

