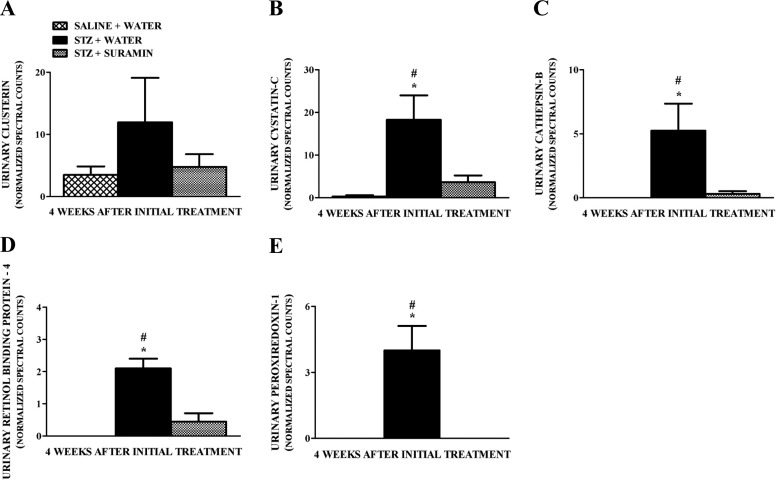
Fig. 3.
Quantitation of normalized spectral counts for clusterin (A), cystatin C (B), cathepsin B (C), retinol-binding protein-4 (D), and peroxiredoxin-1 (E) in the urine samples of nondiabetic and diabetic rats ± suramin intervention at week 4 after the initial treatments. Spectral counts were normalized using HIV envelope protein, which served as the internal standard. Data are expressed as means ± S.E. (n = 4). *, significant from the respective nondiabetic saline + water controls. #, significant from the respective diabetic STZ + suramin-treated group (p ≤ 0.05).

