Fig. 6.
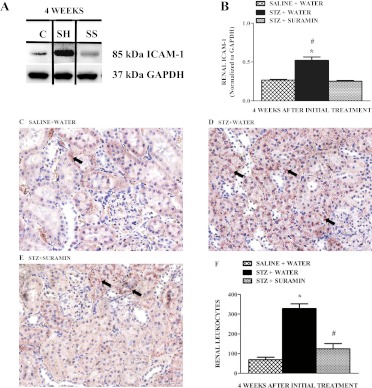
Representative Western blot showing ICAM-1 (A) protein expression and its densitometric analysis (B) in kidneys of nondiabetic and diabetic rats ± suramin intervention at week 4 after the initial treatments. Data were normalized by GAPDH, which served as internal control. Data are expressed as means ± S.E. (n = 4). *, significant from respective nondiabetic saline + water controls; #, significant from respective diabetic STZ + suramin-treated group; p ≤ 0.05. Representative photomicrographs of neutrophil and monocyte staining assessed by the formation of a stable pinkish-red colored (arrows) complex of free naphthol and diazonium salts after incubation of kidney sections from nondiabetic rats (C) and diabetic rats treated without suramin (D) and with suramin (E) after 4 weeks. All fields were chosen from the OSOM. Original magnification, 200×. F, quantitative analysis of renal leukocyte infiltration assessed by the number of pink colored dots in a total of 25 fields in the OSOM region of kidney sections. Data are expressed as means ± S.E. (n = 4). *, significant from the respective nondiabetic saline + water controls. #, significant from the respective diabetic STZ + water-treated group (p ≤ 0.05). C, nondiabetic saline + water control. SH, diabetic STZ + water; SS, diabetic STZ + suramin.

