Figure 3.
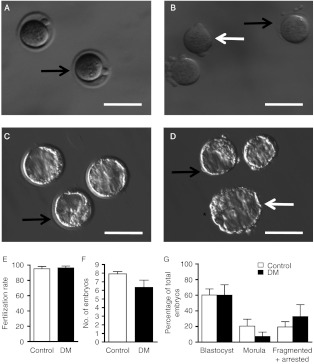
In vitro development of preimplantation embryos. Images of embryos collected and cultured in vitro from Control (A and C) and DM (B and D) 6-week group females. (A and B) Presumptive zygotes collected at 0.5 dpc. (C and D) Blastocyst after 4 days in culture. Black arrow indicates ZP; white arrows indicate DM embryos without ZP; asterisk indicates a bigger blastocyst that seems to have resulted from the fusion of two embryos because the number of embryos present in this dish was reduced by one. (E) Fertilisation rate of Control (n=12) and DM (n=6) females. (F) Total number of embryos at the end of the culture period from Control and DM females. (G) Percentage of blastocysts, morulae, fragmented and arrested embryos in Control and DM females at 4.5 dpc. Results are expressed as mean±s.e.m. Bar scale=100 μm.

