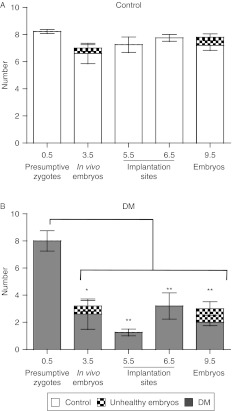
Figure 5.
Numbers of eggs ovulated and pre- and post-implantation embryos in Control and DM females at four developmental stages. The graph shows the number of eggs ovulated (0.5 dpc; presumptive zygotes), preimplantation embryos (3.5 dpc) and implanted embryos (5.5, 6.5 and 9.5 dpc) in Control (A) and DM (B) females. *P<0.05; **P<0.01, with regard to the zygotes collected at 0.5 dpc. Results are expressed as mean±s.e.m.

