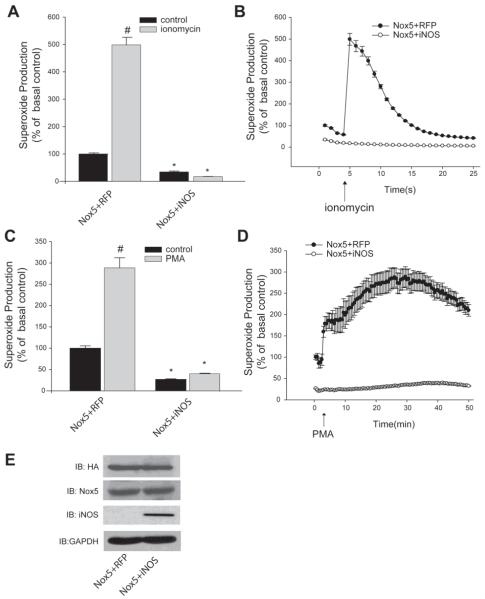
Figure 1. Endogenous NO suppresses basal and stimulated Nox5 activity.
COS-7 cells were co-transfected with Nox5 and either iNOS or RFP (control) and stimulated with (A-B) ionomycin (1μM) or (C-D) PMA (100nM). Production of superoxide was determined via chemiluminescence and expressed as % of control (means ± S.E., n =6 * p<0.05 versus RFP, # p<0.05 versus ionomycin or PMA). Maximal superoxide is shown in the bar graph (left) and superoxide recorded over time in the line graph (right). (E) Expression of Nox5 was detected by Western blot with anti-HA and total Nox5 polyclonal antibody, iNOS expression was detected by iNOS antibody GAPDH was used as loading control.

