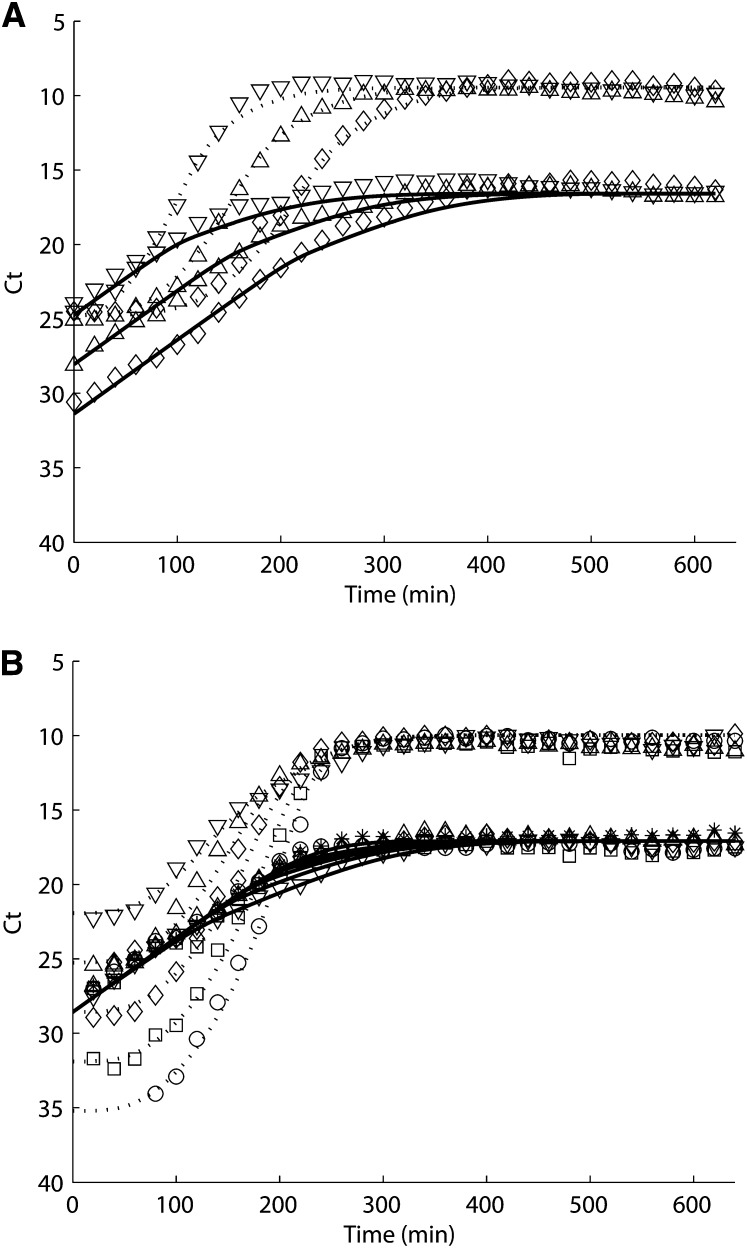
Figure 4 .
(A) Varying cell concentration and (B) varying phage concentration experiments simulation of tolC (solid line) and M13 (dotted line) and quantitative PCR data (closed symbol). Each plot represents a different inoculation ratio of F+ cells to M13 phages: (A) 1:1 (downward-pointing triangle), 1:10 (upward-pointing triangle), 1:102 (diamond); (B) 1: 102 (downward-pointing triangle), 1:10 (upward-pointing triangle), 1:1 (diamond), 10:1 (square), and 102:1 (circle).

