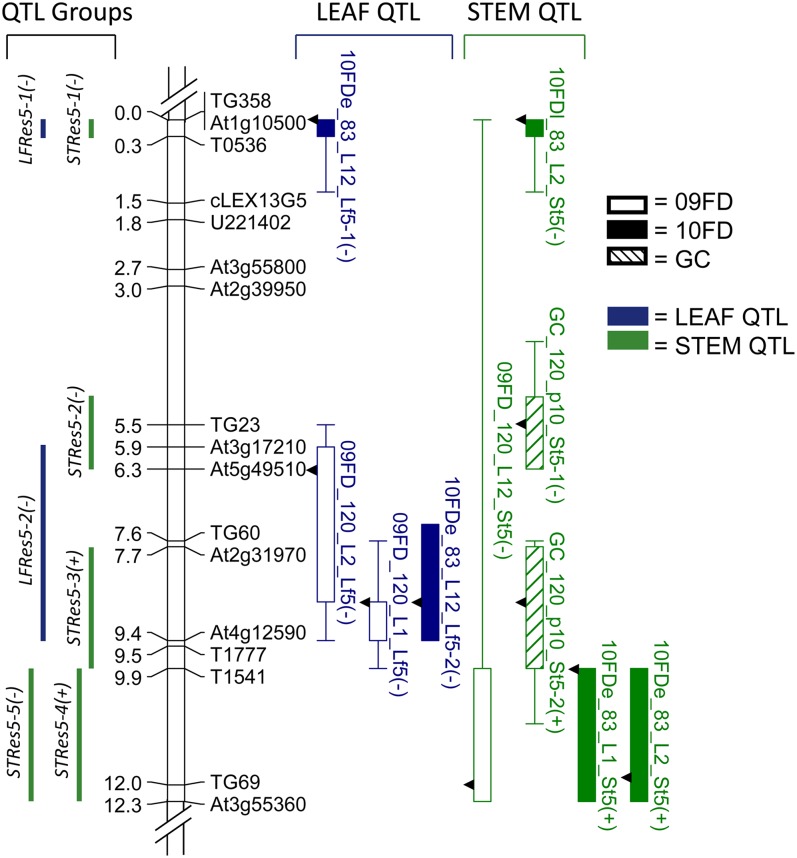
Figure 1.
Linkage map of chromosome 5 introgressed region from S. habrochaites and QTL for LEAF and STEM traits. Left of linkage map are QTL group locations and distances in cM; right of linkage map are QTL detected for LEAF and STEM traits. Boxes and whiskers show 1-LOD and 2-LOD intervals, respectively. Arrows on QTL bars indicate LOD peak locations. QTL names are given by dataset, location or isolate, and trait evaluated (see Materials and Methods). The effect of the S. habrochaites allele at a QTL is indicated after the QTL name: a minus sign (−) indicates a decrease in AUDPC and thus an increase in resistance.

