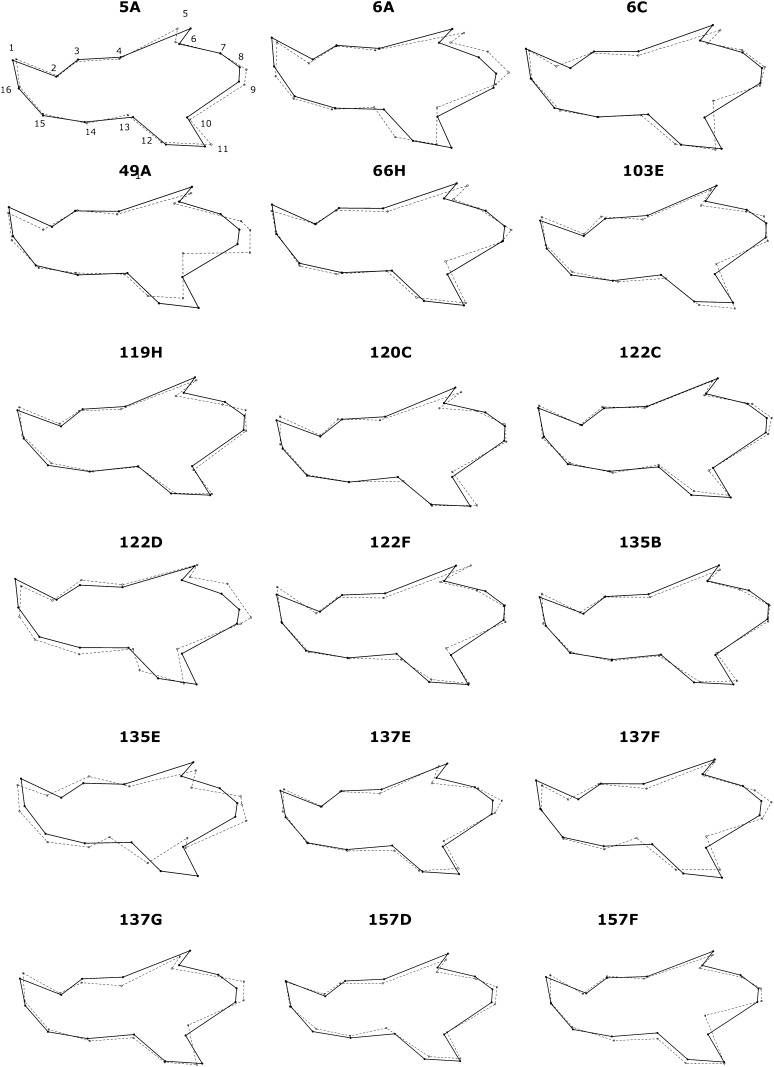
Figure 2.
Visualization of the mandible shape of the IRCSs compared with C57BL/6. In each diagram, the landmarks are indicated by dots. The solid lines represent the mean shape for C57BL/6, and the dashed lines represent the mean shape for the IRCSs, indicating the spatial repartition of the effects of the introgressed SEG genome (as a form of IRCSs) on the mandible shape. Because the shape differences are subtle, all have been amplified by a factor of five.

