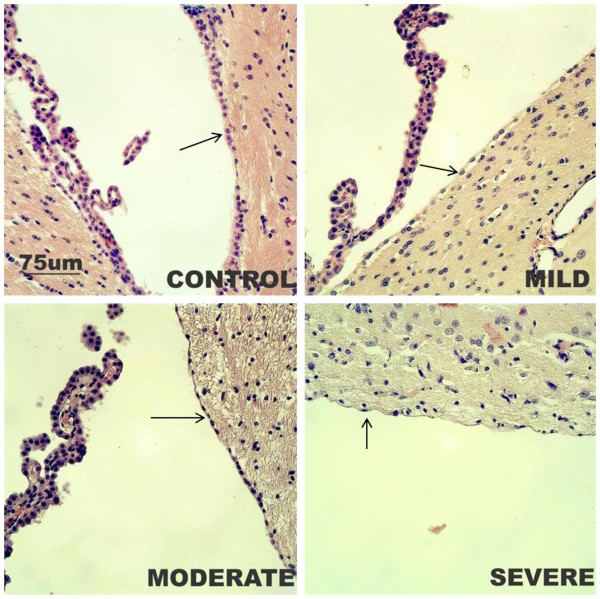
Figure 4.
Comparison of hematoxylin and eosin staining of brain samples. Photomicrographs of the ependymal lining to the lateral ventricle in the control and hydrocephalic rats; note the progressive flattening of the ependymal cells with increasing ventriculomegaly (arrows). Scale bar (75 μm) is the same for all the photomicrographs.

