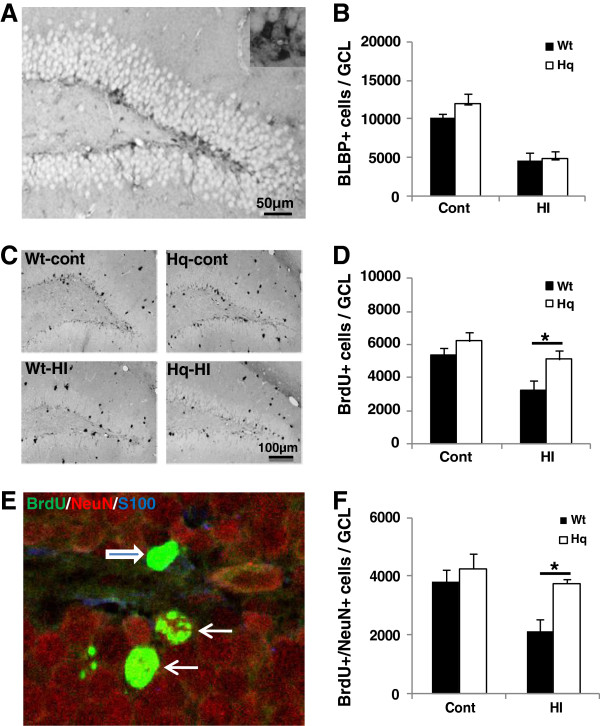
Figure 3.
Survival and differentiation of proliferated cells in the DG 4 weeks after HI. A. Representative microphotograph of BLBP staining in the DG 4 weeks after HI. B. The bar graph shows quantification of the total number of BLBP-positive cells in the SGZ. C. Representative microphotographs after BrdU staining in the DG at 4 weeks after HI. D. Quantification of BrdU-positive cells in the DG (GCL+SGZ) in the control (Cont) and ipsilateral hemisphere after HI in Wt and Hq mice. E. Representative microphotograph showing triple labeling of BrdU/NeuN/S100 in the DG. F. Quantification of the number of BrdU/NeuN double-positive cells (neurons) in DG (GCL) in the control (Cont) and ipsilateral hemisphere after HI in Wt and Hq mice. * P<0.05.

