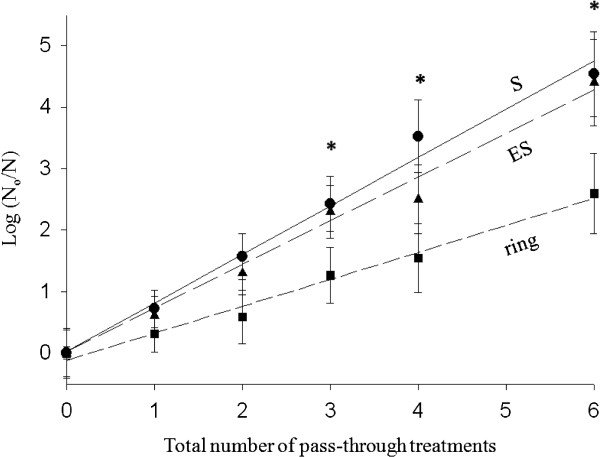
Figure 4.
Dose–response curves for NIR laser-induced inactivation of Plasmodium falciparum. The log of ratio of number of un-irradiated parasites at the indicated phase to the number of parasites left after exposure to the laser; plotted against the number of times the entire blood sample passed through the laser beam, on a log-linear graph. Each data point represents the mean of three repetitions and the bars represent SEM. Data points with asterisks represent the number of pass-through times for which the mean value of log (No/N) for ring phase parasite was statistically different (p < 0.05) from the corresponding value obtained for early and late phase parasites. ES, early trophozoites; S, late trophozoites.

