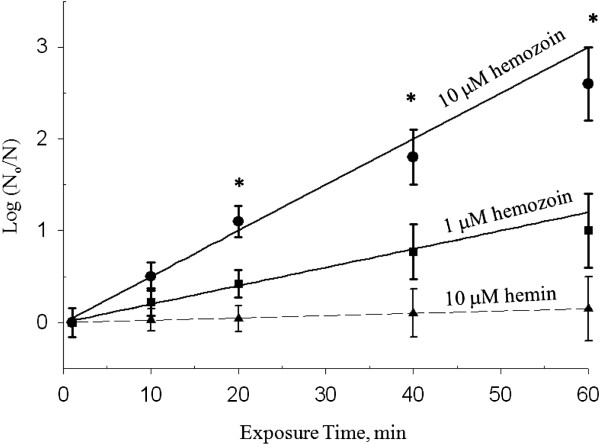
Figure 6.
Dose-response curves for NIR laser-induced inactivation of E. coli in the presence of synthetic haemozoin. The ratio of number of bacteria left after exposure to laser to the number of un-irradiated bacteria; plotted against irradiation time on a log-linear graph. Also shown is NIR laser-induced killing of E. coli in the presence of 10 μM haemin. Each data point represents the mean of four repetitions and the bars represent SEM. Data points with asterisks represent exposure times for which the mean value of log (No/N) in the presence of haemozoin was statistically different (p < 0.05) from the corresponding value obtained in the presence of haemin.

