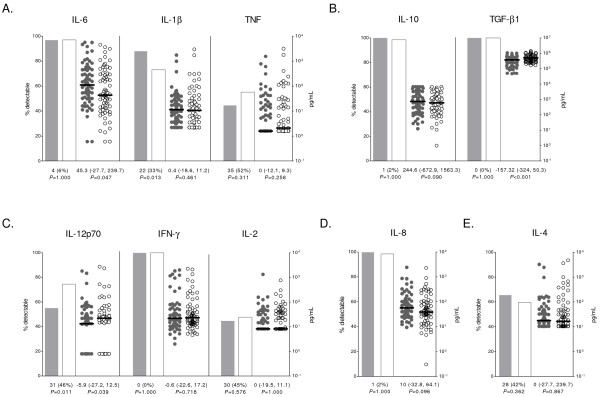
Figure 3.
Plasma concentrations of cytokines and chemokines.(A) Pro-inflammatory cytokines, (B) immuno-regulatory/anti-inflammatory cytokines, (C) Th1 cytokines, (D) pro-inflammatory chemokine and (E) Th2 cytokine. Percentage of detectable cytokines/chemokines is represented by bars; concentrations are represented by dot plots, with horizontal lines indicating median values. Data from children with SM is shown as shaded bars/dots; data from children with UM is shown as open bars/dots. Results of matched comparisons are reported in the x axis as the number (%) of divergent pairs for cytokine/chemokine prevalence, and the median difference (inter-quartile range) of cytokine/chemokine concentrations between SM and UM (in ng/mL for TGF-β1). P-values were calculated using McNemar’s or Sign test. All comparisons were corrected by the Monte Carlo permutation test (1000 random permutations).

