
Figure 1.
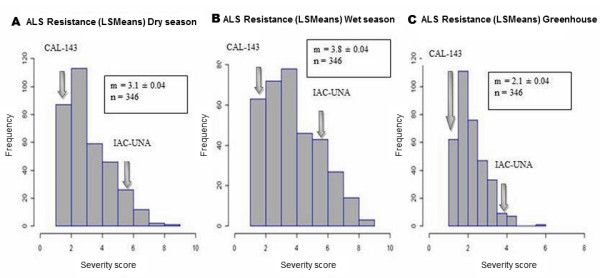
Distribution of angular leaf spot (ALS) severity scores (Least Square Means - LSMeans).A. Scores from RILs evaluated in the field during wet season and B. during dry season; C. severity scores from greenhouse experiments. Severity values of the parental lines (IAC-UNA and CAL 143) are indicated by arrows.