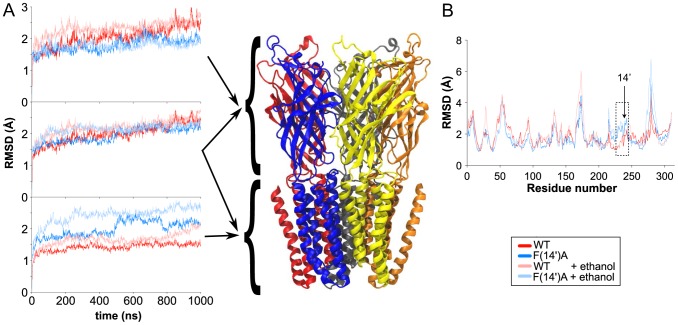
Figure 1. Structural deviation of GLIC simulations.
(A) Cα RMSD of the ECD (upper panel), whole protein (middle panel), and TMD (lower panel) for the WT (dark red), F(14′)A (dark blue), WT+ethanol (light red), and F(14′)A+ethanol (light blue) simulations relative to the GLIC crystal structure (PDB ID 3EAM). Right hand panel shows the GLIC structure colored by chain. (B) Average RMSD per residue over the four 1-µs simulations, colored as in (A). ECD includes residues 5 to 195, TMD residues 196 to 315. Box indicates high-RMSD residues 222–245, with residue 238 labeled according to M2 prime notation (14′).

