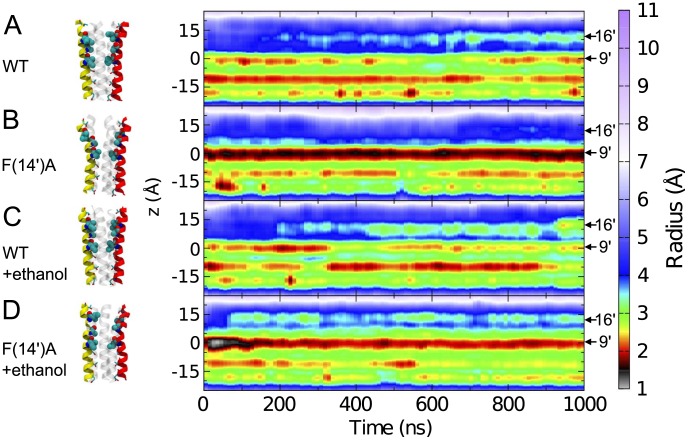
Figure 2. Pore constrictions.
Pore radius as a function of membrane z-axis plane (left axis) and time (lower axis) for the (A) WT, (B) F(14′)A, (C) WT+ethanol and (D) F(14′)A+ethanol simulations. Prominent constriction points were observed around 10 Å/I(16′), 0 Å/I(9′), −10 Å/T(2′), and −18 Å/E(−2′). Structures on the left show the pore helices at the end of the 1-µs simulation with two M2 helices colored red and yellow and the three others as transparent cartoons. Residues lining the pore are shown as spheres for hydrophobic residues I(16′) and I(9′) and as sticks for polar residues T(20′), S(6′), T(2′) and E(−2′).

