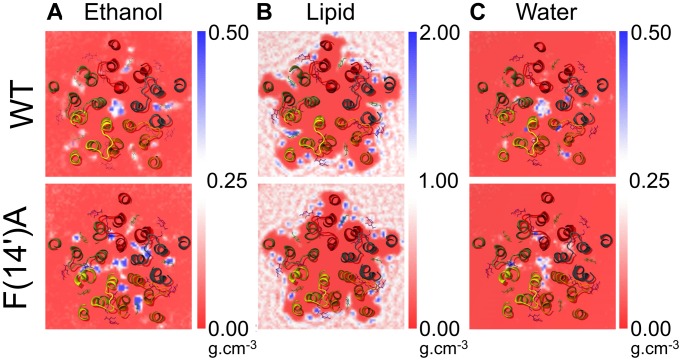
Figure 4. Effect of F(14′)A on the occupancy.
(A) Ethanol, (B) DOPC, and (C) water density in the TMD. Densities were averaged over the complete trajectory of the WT (upper panels) and F(14′)A (lower panels) simulations with ethanol. The TMD is colored by chain. For comparison, crystal structures of the GLIC complex with propofol (PDB ID 3P50) [23] and the GluCl complex with ivermectin (PDB ID 3RHW) [22] were aligned on the TMD Cα atoms, and the corresponding propofol and ivermectin molecules were displayed as green and pink sticks, respectively. For WT, ethanol bound predominantly in the intra-subunit cavity in a similar position to propofol; in F(14′)A, ethanol bound to the intra- and inter-subunit cavities equivalently.

