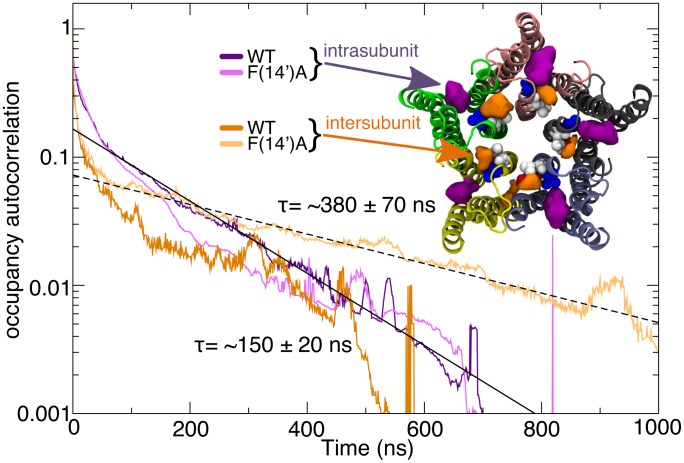
Figure 6. Ethanol exchange rates.
Occupancy autocorrelations for ethanol molecules that exhibit cavity occupancy at some point in each simulation, colored according to the site and system. The slow component of ethanol exchange was fit by an exponential (solid line) with τ∼150 ns and a standard error of 20 ns for the intra-subunit WT (dark purple). The F(14′)A (light purple) site is not does not exhibit any statistically significant difference, and the very limited amount of ethanols present inter-subunit for WT (dark orange) makes a fit difficult. In contrast, the inter-subunit F(14′)A cavity (light orange) exhibits significantly slower exchange, fit by an exponential (dashed) with τ∼380 ns and a standard error of 70 ns.

