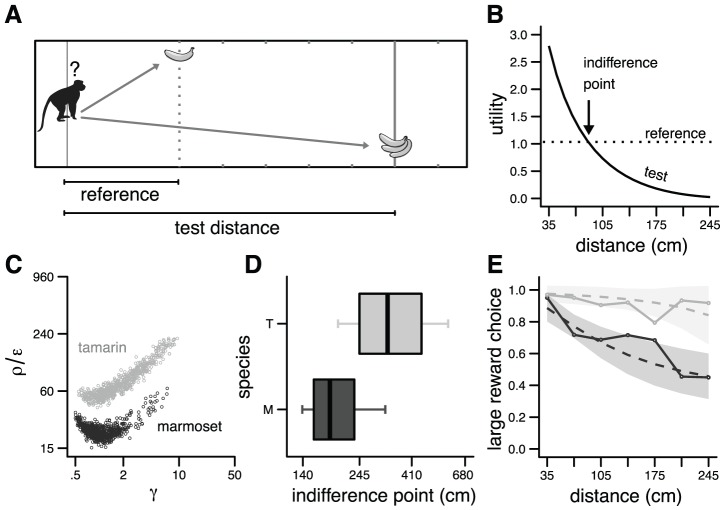
Figure 2. Simulation of Stevens [3] .
A. Cost/benefit choice task between a reference option (small reward/short distance) and a test option (large reward/long distance). B. Utility vs distance. The dotted line indicates the utility for the reference option (r = 1, distance = .35 m). The solid line gives the utility for the test option (r = 3) for different distances (range .35–2.45 m). An arrow indicates the distance at which the preference changes. Results obtained with Object I. Parameters: ρ/ε = 1, γ = 2. C. Vigor and discount factors for synthetic monkeys (black: marmosets; gray: tamarins) derived from [3]. The figure was built in the following way. Mean m and standard deviation σ of displacement duration were obtained from Fig. 3 in [3] for each species and each amplitude. For each species, a random sample was drawn from the corresponding Gaussian distribution N(m,σ) for each amplitude, giving two durations. These two durations were used to identify a unique pair of parameters (vigor, discount). Each point corresponds to one pair. See Text for further explanation. D. Indifference points corresponding to the simulated monkeys shown in C (T = tamarin, M = marmoset). Bold bar is the median, hinges correspond to the first and third quartile (50% of the population), and whiskers to the first and ninth decile (90% of the population). E. Probability of choosing the large reward option according the test distance. Solid lines are the experimental data from Stevens [3]. Dashed lines and shaded areas correspond respectively to the mean and the 95% confidence interval of the decision process derived from the simulated utilities and a soft-max rule. The temperature parameter was selected for each monkey to fit empirical data.

