
Figure 3. IES sequence properties.
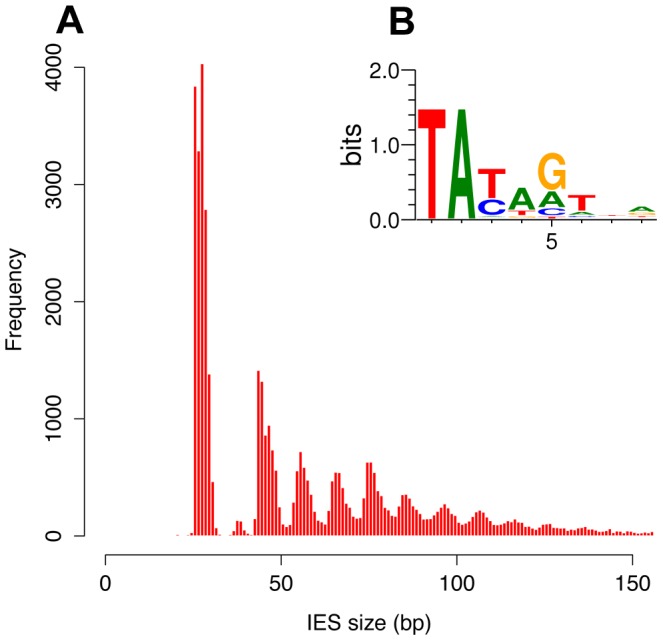
A) Histogram of the sizes of the genome-wide set of IESs that are shorter than 150 bp. B) Sequence logo showing information content at each position, corrected for a G+C content of 28%, for the ends of the genome-wide set of IESs.