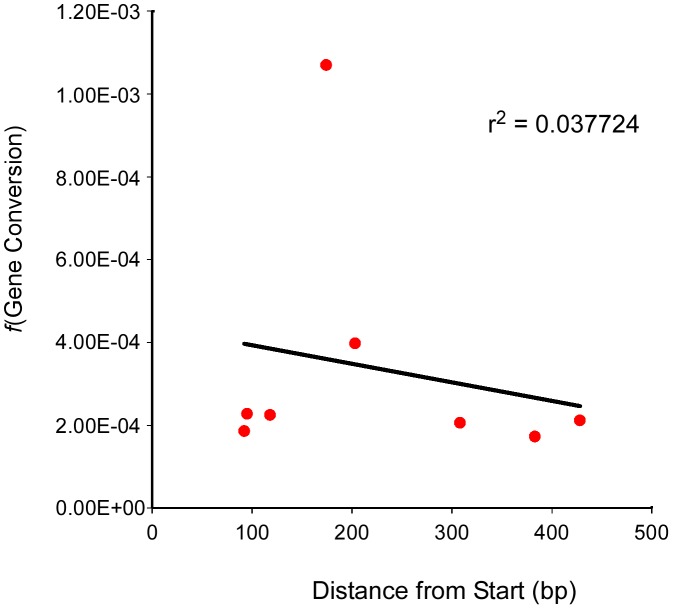
Figure 3. Test locus SNP position and conversion frequency lack correlation.
The frequency of gene conversion (Y-axis) at each test locus (and for one locus, two different alleles) was plotted against the position of the polymorphic marker (SNP) at that locus (X-axis). A linear regression for the scatter plot was generated as well as an r2 value.

