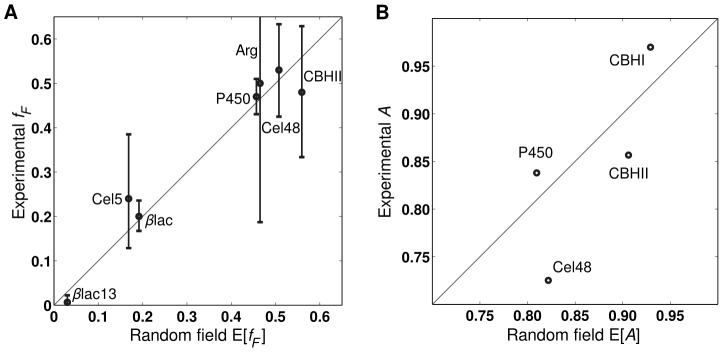
Figure 3. Comparison between library properties and their expected values within the random field model.
Note diagonal lines represent  . (A) The random field's expected fraction of functional sequences shows quantitative agreement with experimental results (
 with
with  ). Error bars represent the binomial 95% confidence intervals calculated using the Clopper-Pearson method [51]. (B) The expected additivity agrees well with experimentally determined values (
 with
with  ). While the small data set limits the statistical significance of this correlation, all
  s are large and within the ranges that are observed experimentally.

