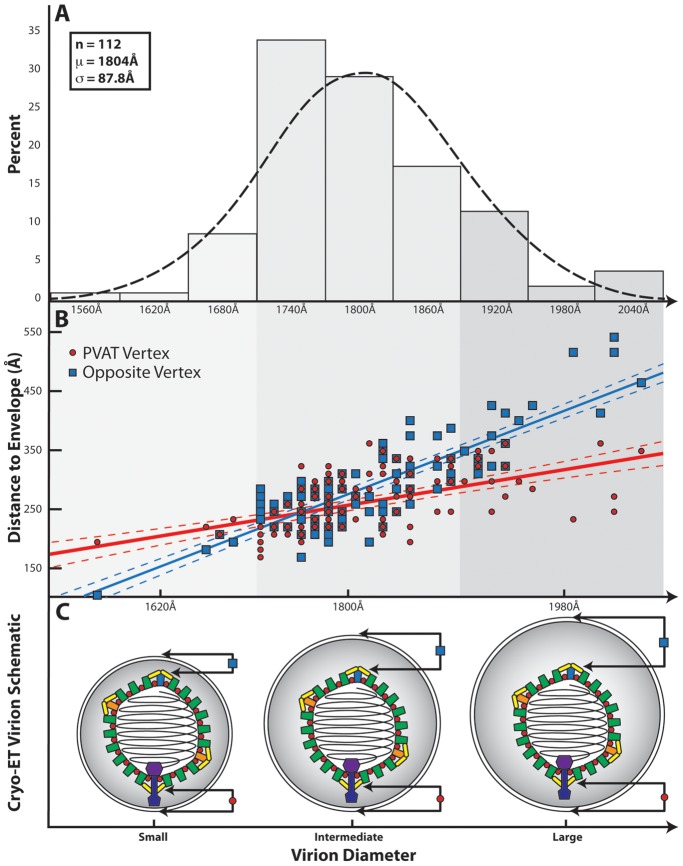
Figure 4. Influence of the PVAT on capsid-envelope eccentricity.
(A) Distribution of HSV-1 virion diameters for 112 of the virions used in the final reconstruction. (B) Graph showing the separation of the envelope from the capsid shell (defined as 625 Å from the center of the capsid) measured at the portal vertex (red line) and at the opposing pentonal vertex (blue line), and plotted as a function of virion diameter. The difference in slope between the two lines is a clear indication that the capsid is not randomly positioned within the envelope. Note that the vertex closest to the envelope is not always the portal vertex. (C) Schematic illustrating the spatial relationship between the HSV-1 capsid and the envelope for small, intermediate, and large sized virions, as predicted from (B).

