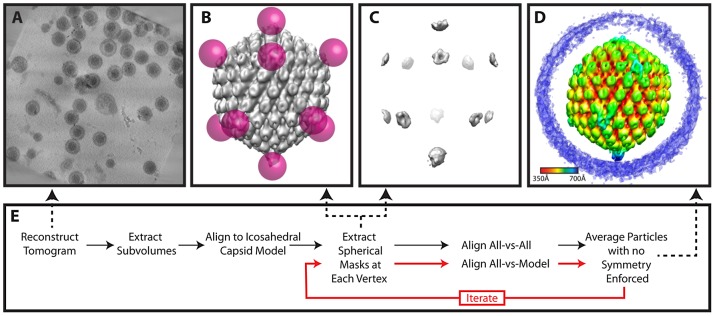
Figure 6. Workflow for melon ball alignment.
(A) Projected slices from a representative tomogram of HSV-1 virions. (B) 12 spherical masks (magenta), in an icosahedral arrangement, superimposed on a map of the capsid (grey), showing the relationship of the masks to the capsid surface. (C) Density extracted by the masking procedure in (B). After generating an initial model, the model may be updated iteratively by realigning the particles (red lines). (D) Final melon ball aligned average, radially colored. (E) Flow chart of the procedure (described in detail within the Materials and Methods).

