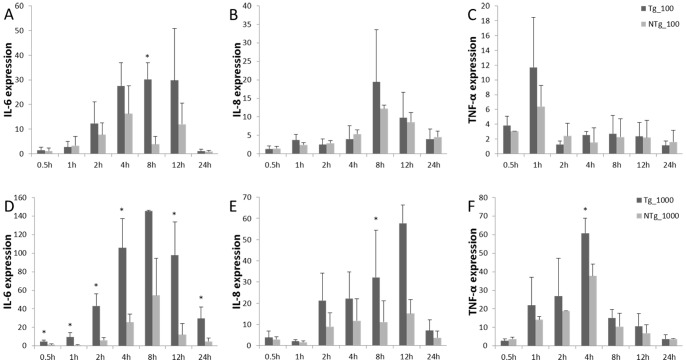
Figure 7. Expression pattern of fibroblast immune factor (IL-6, IL-8, TNF-α) under LPS stimulation and the expression pattern of IL-6, IL-8, and TNF-α under 100ng/mL LPS stimulation (A, B, and C).
Expression patterns of IL-6, IL-8, and TNF-α under 1000 ng/mL LPS stimulation (D, E, and F). Data are means ± SE. * Different superscripts indicate significantly different values between different groups (P<0.05). Tg = transgenic sheep, NTg = non-transgenic sheep.

