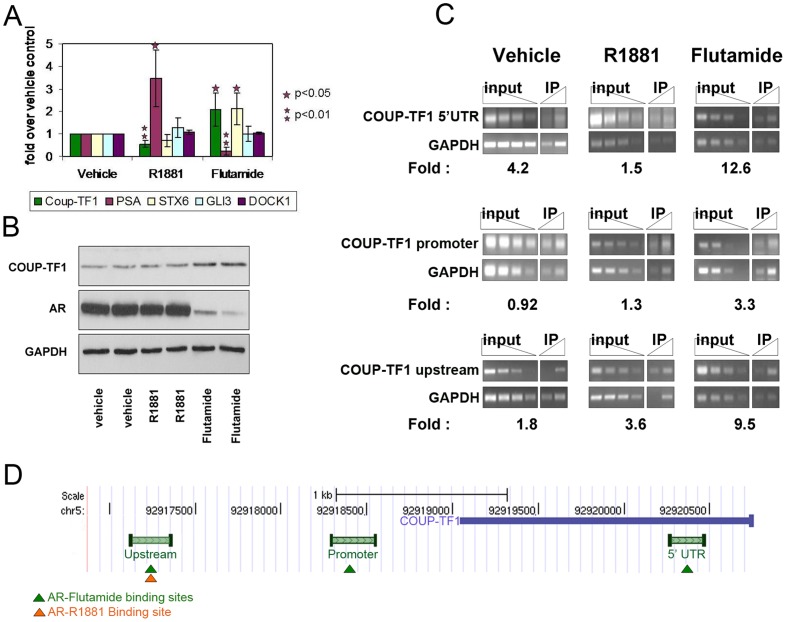
Figure 2. COUP-TF1 is a direct negatively regulated target of AR.
A. LAPC4 cells were androgen deprived for 72 hours and then treated with a synthetic androgen (R1881), an AR antagonist (flutamide) or vehicle (ethanol) for 24 hours. Real-time PCR was used to quantify mRNA levels of the indicated genes. Each expression level was adjusted to GAPDH mRNA level and shown as fold change from vehicle treated control. Each bar represents at least four experiments each done in triplicates. P-value was calculated using student's t-test, compared to vehicle treatment. B. Western blot analysis showing COUP-TF1 and AR expression levels following treatment with R1881 or Flutamide for 48 hours. Each treatment group was performed and shown in duplicates. C. Analysis of AR binding to the COUP-TF1 genomic locus. LAPC4 cells were androgen deprived for 72 hours and then treated with a synthetic androgen (R1881), an AR antagonist (flutamide) or vehicle (ethanol) for 16 hours. ChIP with an anti AR antibody was performed. PCR for the indicated areas surrounding the COUP-TF1 transcription start site compared to non-bound gene are presented for 3 fold dilutions of input and immunoprecipitated fraction. Enrichment of binding to each region compared to a non-bound promoter (GAPDH) is quantified below each image. PCR for the 5′ UTR of COUP-TF1 is presented in uppermost panel (COUP-TF1 5′UTR), binding to the COUP-TF1 promoter is presented in the middle panel and binding to a region upstream to the promoter (COUP-TF1 upstream) is presented in the lowermost panel. D. Schematic representation of AR binding sites in the genomic locus surrounding coup-tf1 TSS, shown in figure C. Green bars represent areas analyzed for AR binding. Genomic locations of AR binding in the presence of flutamide and R1881 are marked by green and orange triangles respectively.

