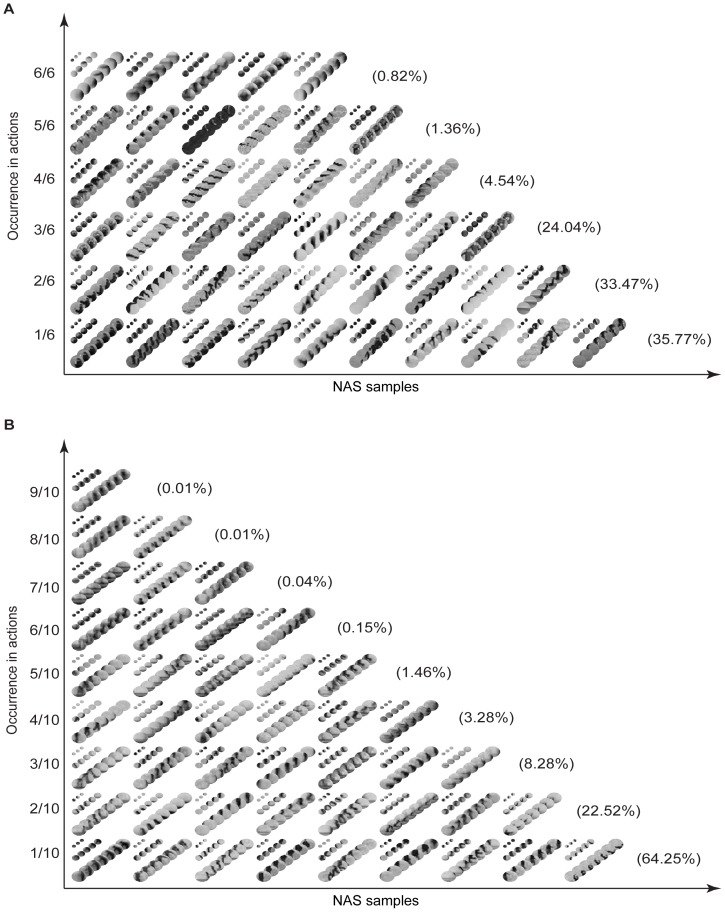
Figure 6. Statistics of occurrences of NASs.
(A), Examples of NASs shared by 1 to 6 actions in the KTH dataset. The numbers are the percentages of the NASs shared by 1 to 6 actions. (B), Same format as (A) for the Weizmann dataset. Note that each NAS is a set of patch sequences and also that each NAS shown is the average of all patch sequences that share the same structural indices.

