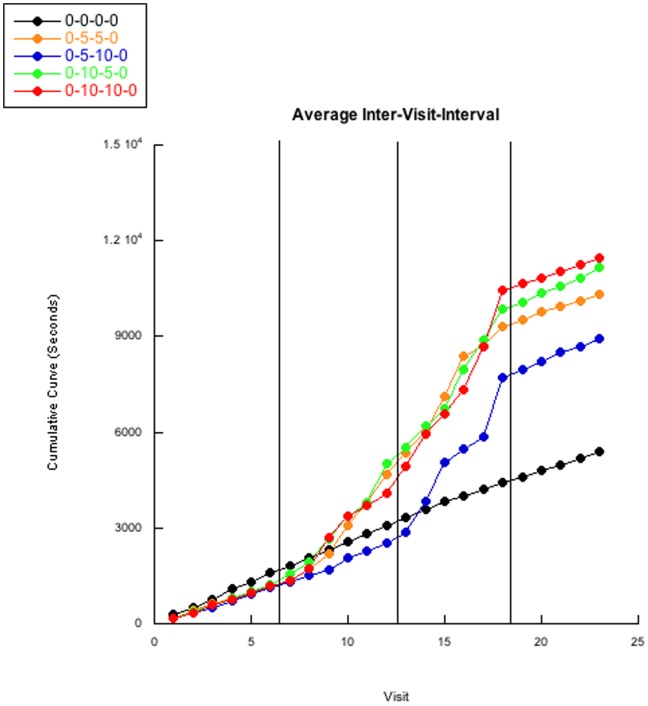
Figure 1. Averaged inter-visit-interval.
The averaged cumulative curves of group inter-visit-intervals are presented. All group’s baselines are very similar during the first condition of the experiment. The averaged control 0-0-0-0 group maintains this increase for the remaining conditions and trials while the averaged 0-5-5-0, 0-10-10-0, and 0-10-5-0 experimental groups begin differing from the control group after about 3 visits of the second condition. The averaged 0-5-5-0, 0-10-10-0, and 0-10-5-0 experimental groups’ curves continue to increase (roughly resembling exponential curves when not presented as a cumulative curve) until the final condition change removing the delay intervals. Curiously, the averaged 0-5-10-0 group (which for the second condition is no different from the averaged 0-5-5-0 group) does not differ from the control group until the third condition (when the delay interval increases to 600 s), but then quickly increases similarly to the remaining experimental groups until the final conditional change removing the delay intervals. Most striking is the immediate near-return to baseline for all four experimental groups’ averages once there are no delay intervals. Table 2 displays average slope values for each condition and group for Figure 1. Individual bee’s cumulative curves can be observed in Figures S1,S2,S3,S4,S5.

