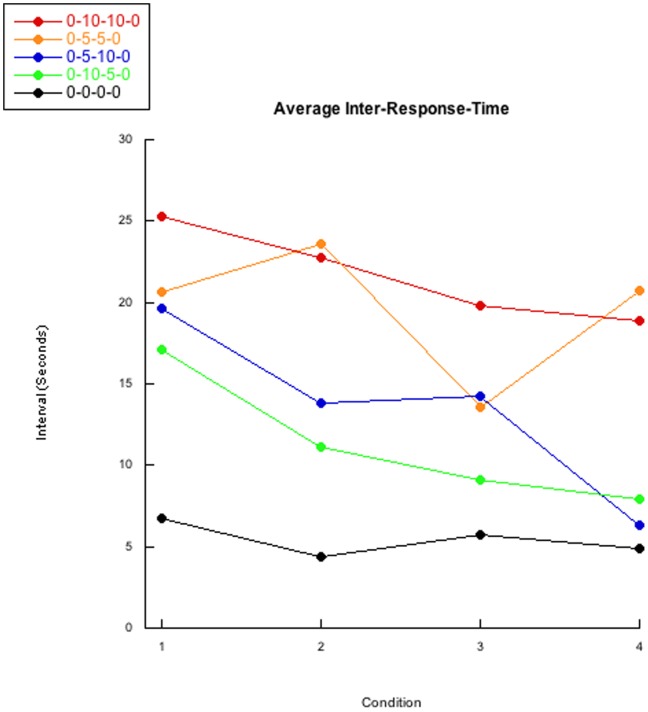
Figure 3. Average inter-response-time.
The averaged group inter-response-times are presented. Save the average of the 0-5-5-0 experimental group, an overall downward trend can be observed. Curiously, the average of the control 0-0-0-0 group’s baseline IRT is much lower than the four experimental group’s.

