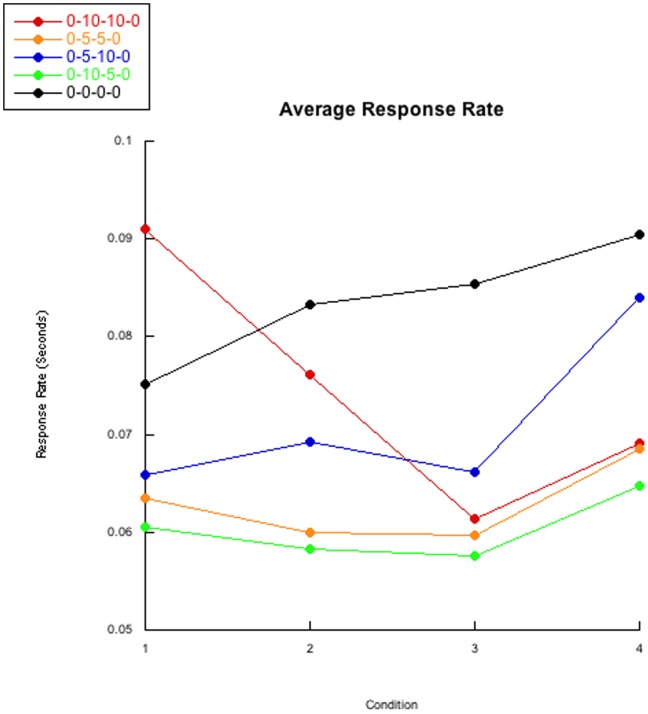
Figure 4. Average response rate.
The condition averages of group response rates are presented. The average of the control 0-0-0-0 group displays a subtle rise across conditions while the experimental groups do not display this increase during the second and third conditions. The removal of the delay intervals for the experimental groups induces a rise in response rate. The average of the baseline for the 0-10-10-0 group differs from the other groups due to one powerful “outlier” which dropped out mid-way through the second condition (visible in Figure S18).

