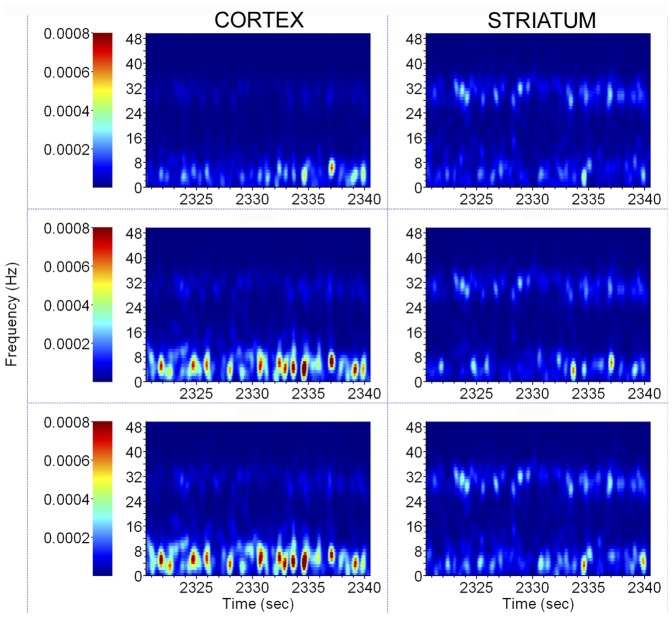
Figure 4. Exemplar PSD results from an R6/2 mouse during three different bouts of quiet rest.
Time-frequency plots illustrate PSD obtained from motor cortex (left panels) and dorsal striatum (right panels) during three different bouts of quiet rest from an R6/2 mouse. The persistence of high frequency (∼32 Hz) rhythms is apparent in both brain regions with greater spectral power in striatum.

