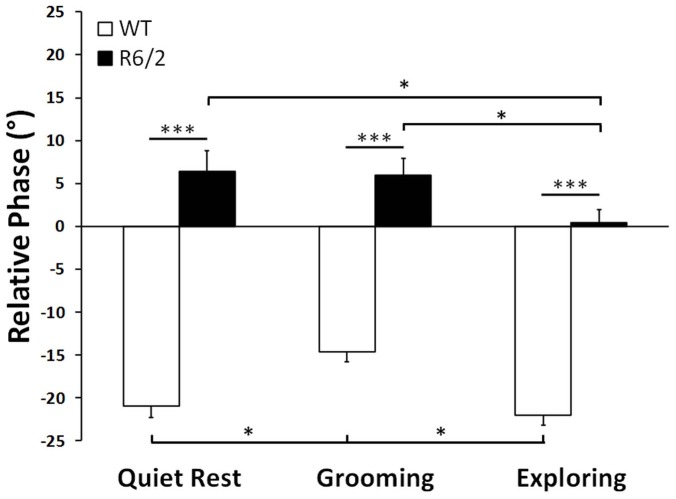
Figure 7. Mean relative phase for both groups across the different behaviors.
Data represent means across the entire frequency range and animals within a group. For each column, the number of mice/epoch for each group at each behavior is the same as in Figure 2. * p = 0.05; *** p<0.001. Error bars denote SEM.

