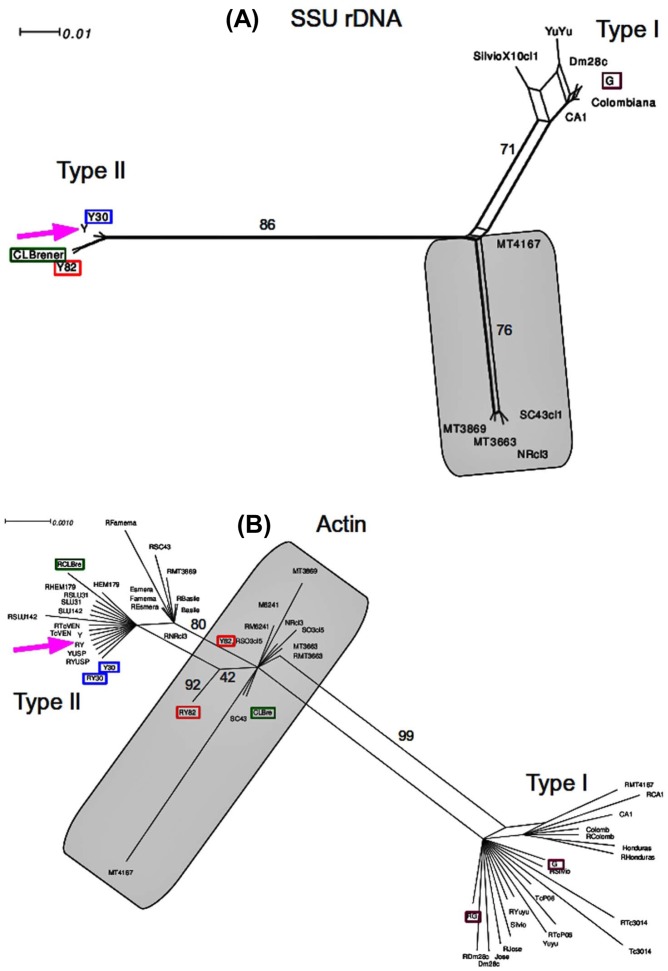
Figure 1. Network genealogy of two T. cruzi nuclear gene sequences.
Analysis of SSU rDNA (A) and actin (B) was performed to verify the genetic diversity of Y30 and Y82 strains. Red boxes indicate Y82 haplotypes, blue boxes Y30 haplotypes, purple boxes G (TcI) haplotypes, green boxes CL Brener (TcVI) haplotypes and the pink arrow indicates the Y strain (TcII) cluster. In haplotype names, the suffix R indicates the copy detected by direct sequencing of PCR products from genomic DNA while the other indicates the sequence obtained from cloned PCR products. The shaded area indicates the hybrid zone between the polar TcI and TcII. Numbers above links indicate bootstrap frequencies from 1000 pseudoreplicates. Networks were inferred using SplisTree 4 [24] as described in Material and Methods.

