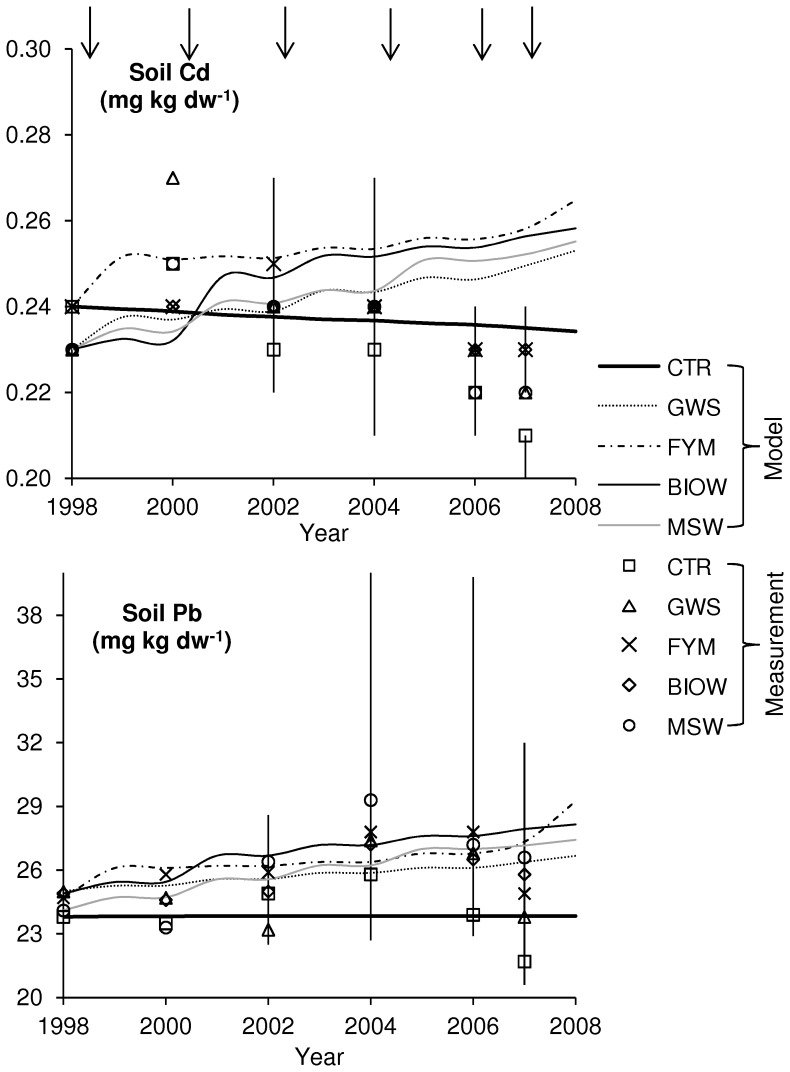
Figure 2. Comparison of predicted and measured concentrations in top soil for the five treatments.
September 1998 to July 2007. Model predictions are connected by lines for clearer comparison to measured values. Vertical lines denote the range of measured values and arrows the time of amendment application. Measured concentrations represent median of four replicates.

