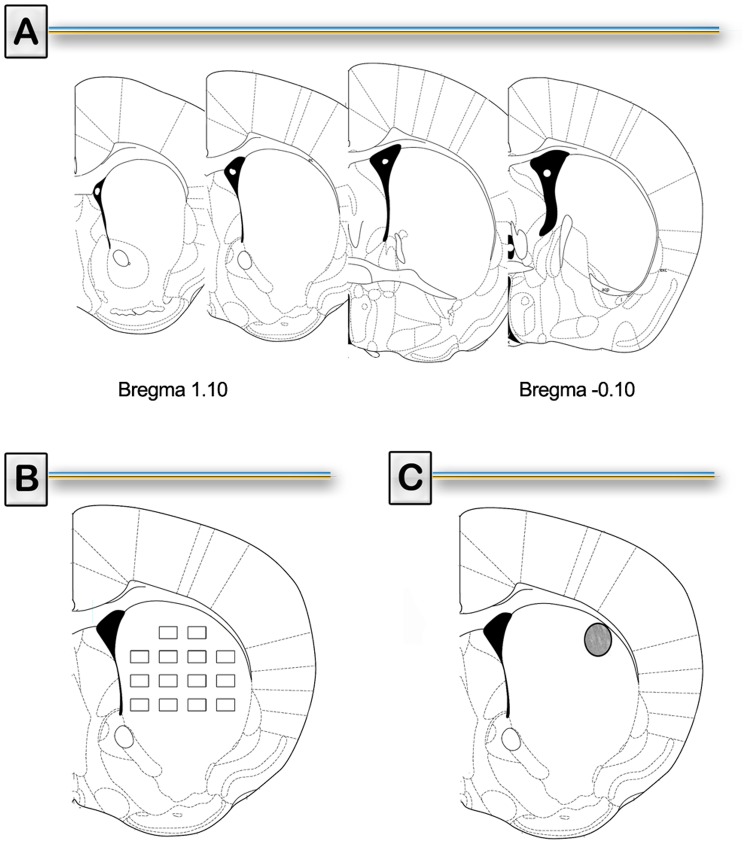
Figure 1. Representative diagrams used for data analysis.
A) Representative coronal striatal sections (Bregma 1.10 to −0.10 mm) obtained from the Franklin and Paxinos atlas [45]. B) Representative coronal striatal section illustrating the placement of 14 probes (236 × 140 µm area) used for the evaluation of microglial and astroglial quantification (Mercator Pro; Explora Nova, France). C) Representative coronal striatal section containing the region of interest in the dorsolateral striatum from where TH and DAT immunoreactivity was determined.

