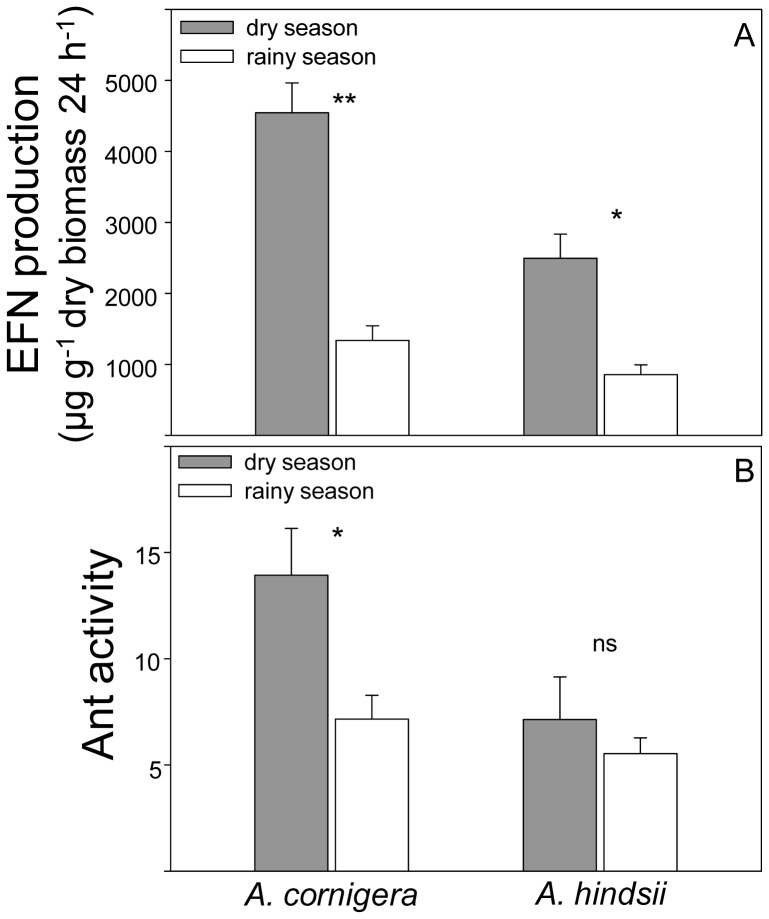
Figure 1. Changes in EFN production and ant activity during the dry and the rainy season.
(A) EFN secretion pattern (µg g−1 dry biomass 24 h−1) and (B) the number of ants that crossed three lines along the plant branch during three minutes in A. cornigera and A. hindsii during the dry (gray bars) and the rainy season (open bars). Data represent mean and standard errors. Asterisks indicate significant differences (*** P<0.001, ** P<0.01, * P<0.05, ns = not significant, Two-way ANOVA).

