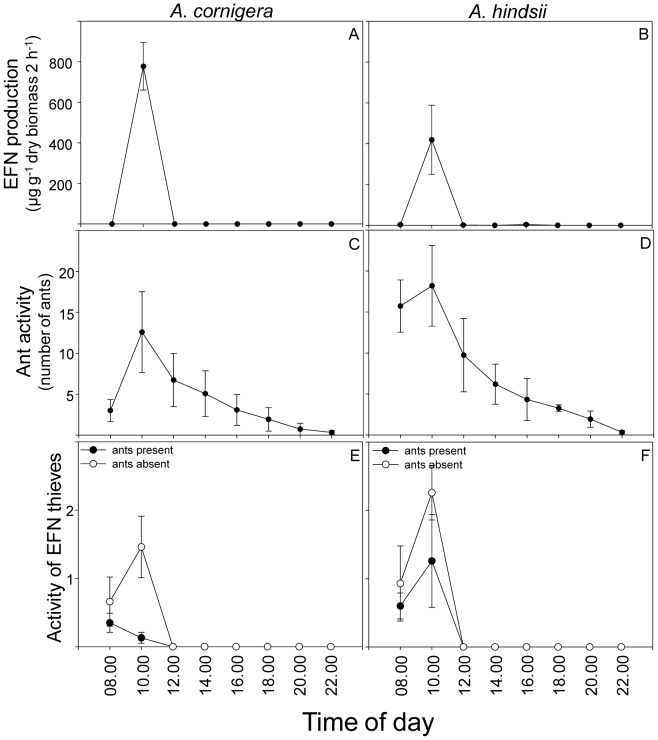
Figure 5. Daily time course of EFN production, ant activity and activity of EFN thieves.
(A, B) Variations in EFN production (µg g−1 dry biomass 24 h−1) and (C, D) ant activity (number of ants) across the day for plants of A. cornigera and A. hindsii. Activity of EFN thieves was quantified in presence (black circle) and absence (white circle) of ants of P. ferrugineus on (E) A. cornigera and (F) A. hindsii (Mixed model analysis).

