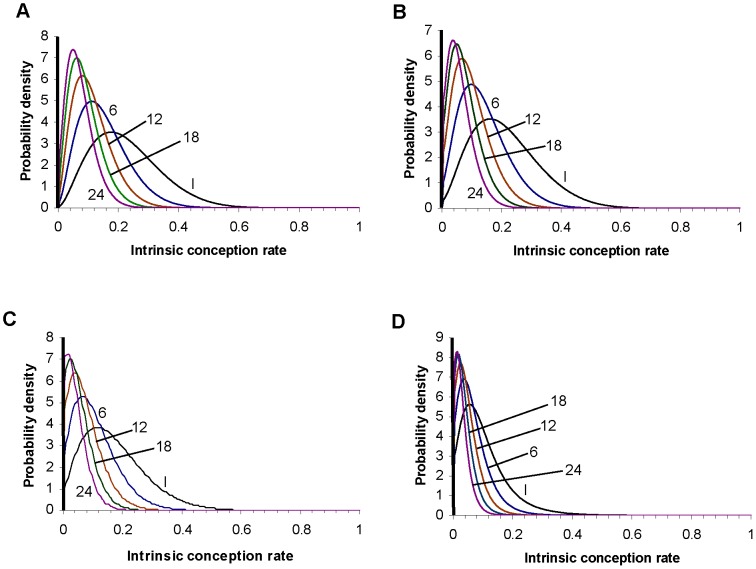
Figure 4. Distribution of the intrinsic conception rate at 4 different female ages at the start of the attempt to conceive, for example 5: (A) age 25, (B) age 30, (C) age 35, (D) age 40.
In each panel the plot labelled I shows the initial (prior) distribution. The other plots show the distribution conditional on non-conception after 6, 12, 18 and 24 cycles. A thick line represents the finite proportion of the population with an intrinsic conception rate of zero. The total area underneath each curve corresponds to the proportion of the remaining population which is not sterile.

